Genome plots by R
Need a circos plot, a chromosome map, and a zoomed-in regional view, and you’d rather not spend an afternoon fighting circlize margins again? Same idea as last time, same afternoon saved.
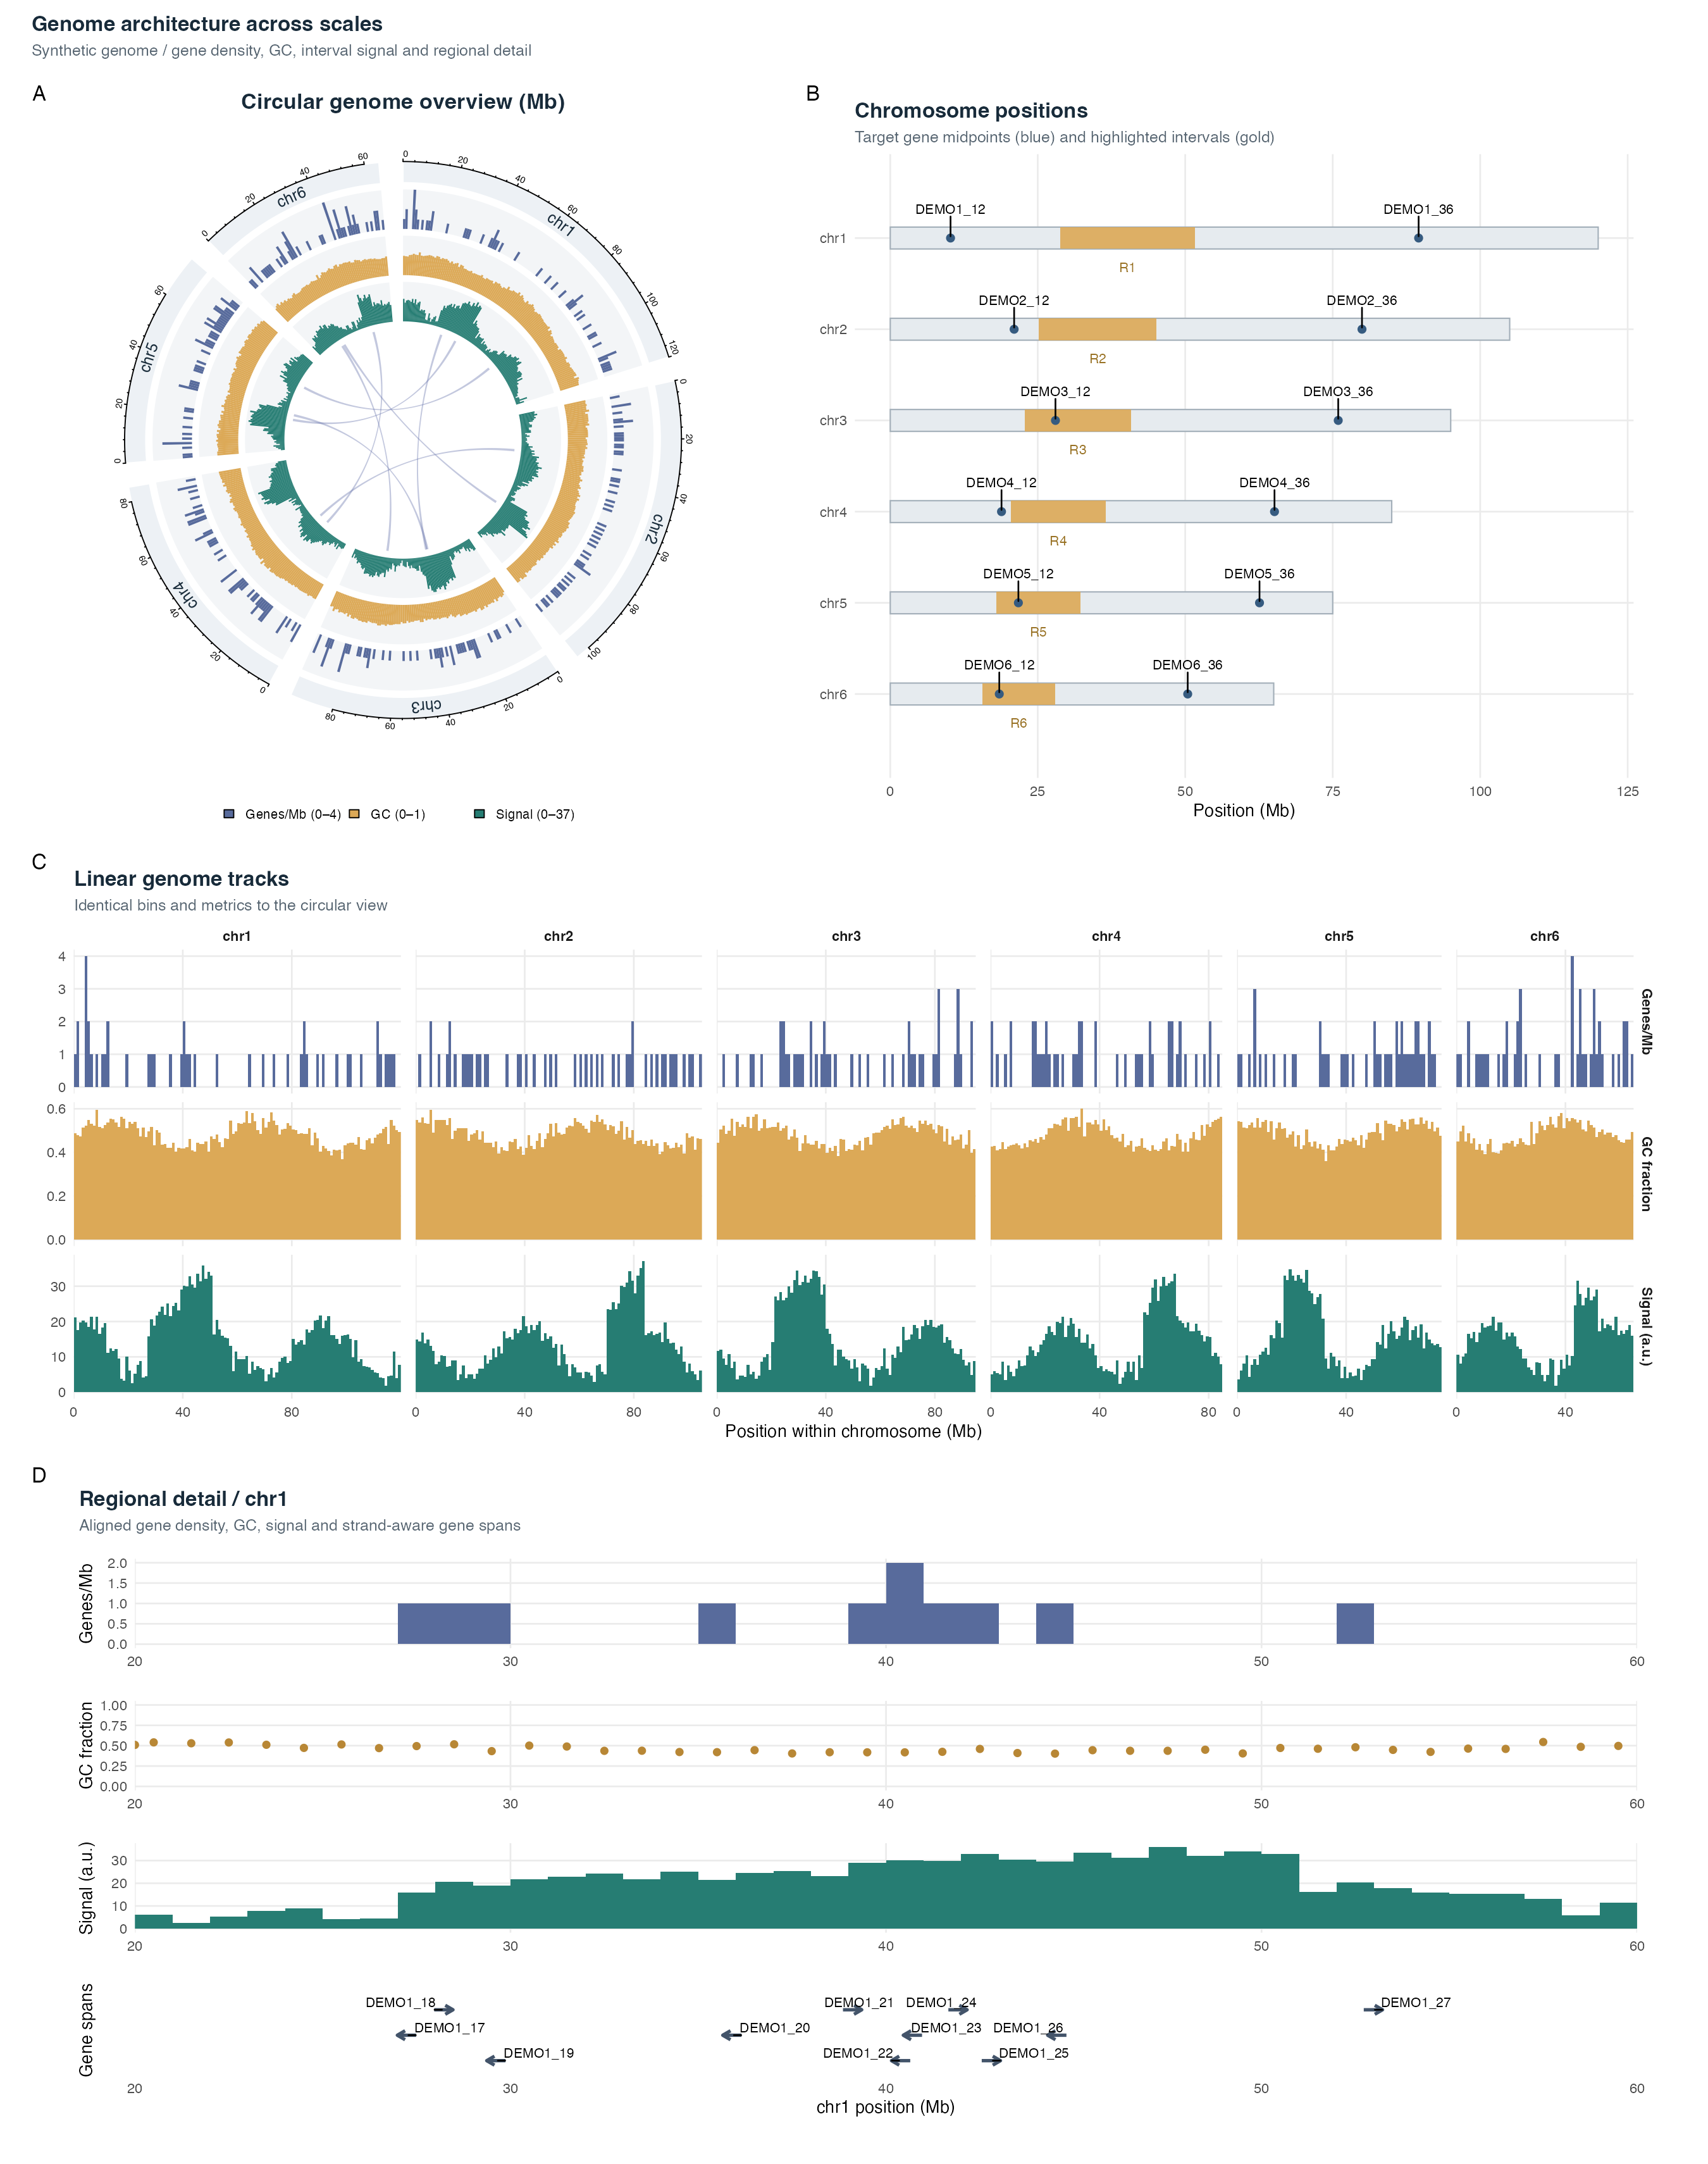
Four views, one coordinate system, no re-deriving Mb math at 2am: A a circular genome overview stacking gene density, GC and signal tracks with interval links through the middle, B a chromosome map marking target genes and highlighted regions, C the same three tracks laid out linearly per chromosome for when circles aren’t the point, and D a regional zoom on one window with strand-aware gene arrows. Patchwork stitches the global and regional views into one composite so the detail panel doesn’t float around looking lost.
The genome is entirely made up — six fictional chromosomes, about 545 one-megabase bins, 288 gene spans. It exists to make the coordinate math behave, not to represent anything you’d find in Ensembl. Point it at your own chromosomes.csv, bins.csv, genes.csv, regions.csv and links.csv and it draws your actual genome instead.
The one thing this project is pedantic about: coordinates are 1-based and closed, both ends included. Coming from a BED file? Add 1 to the start, leave the end alone. Get that wrong once and every track is off by a base — see Ming “Tommy” Tang’s post on exactly this mistake: Most common mistake for bioinformatics.
Running it:
install.packages(c('ggplot2', 'patchwork', 'circlize', 'gridGraphics',
                   'ggrepel', 'ragg', 'svglite'), repos = 'https://cloud.r-project.org')

source('run.R')
Five figures and one composite land in figures/, PNG and SVG both. Every plotting function works on its own too, if all you need today is the circle.
Code’s right here, help yourself: r-genome-plot-gallery