RNA-seq plots by R
Making the same five RNA-seq figures from scratch, every single project, for the hundredth time? Yeah, me too. So I finally sat down and turned the whole mess into one R script that spits out a publication-ready panel figure and doesn’t ask me a single follow-up question.
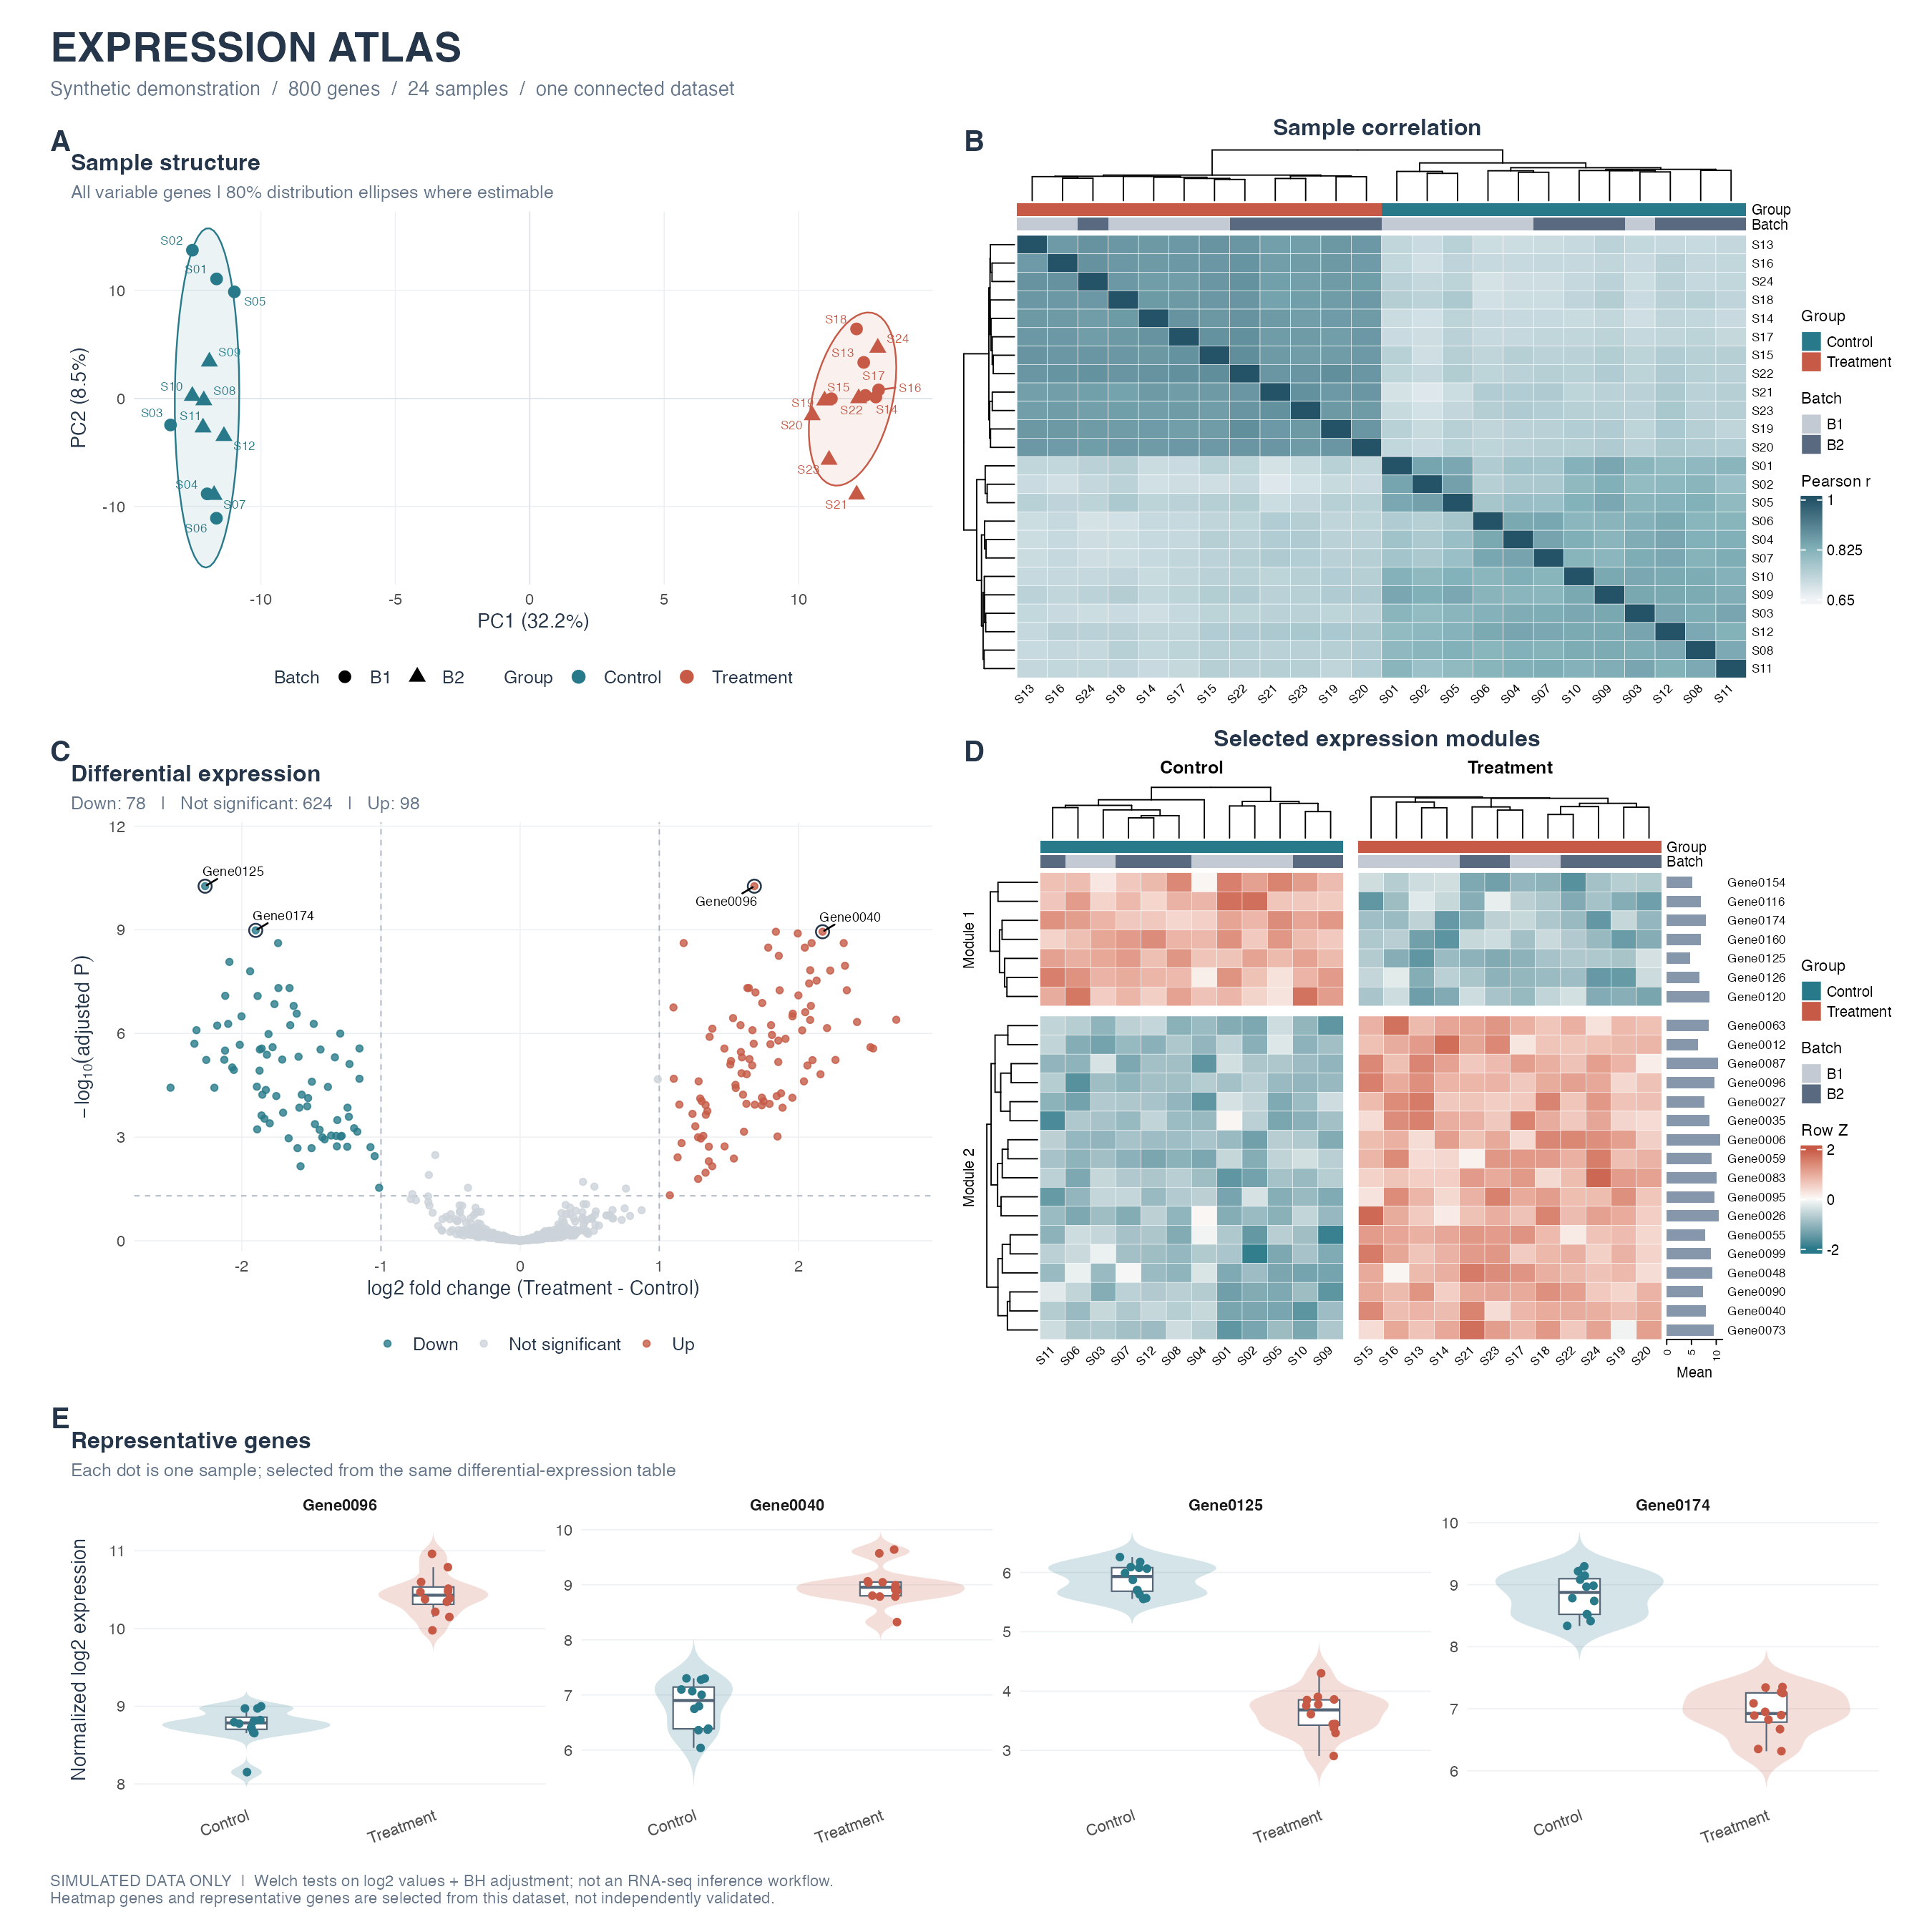
Five panels, one dataset, no copy-pasted ggplot incantations: A PCA with group ellipses and batch shapes, B a sample correlation heatmap that clusters itself, C a volcano plot that actually labels the genes worth knowing about, D a two-module expression heatmap with side bar charts for flair, and E violin plots for the genes everyone’s going to ask about anyway. Patchwork glues them into one A–E composite so nobody has to eyeball five separate PNGs and pretend they form a coherent story.
The example data is 800 simulated genes across 24 samples — two groups, two batches. Swap in your own expression.csv, samples.csv, and differential_expression.csv and the whole pipeline runs on real numbers instead.
Running it is embarrassingly simple:
install.packages(c('ggplot2', 'ggrepel', 'patchwork', 'ragg', 'svglite', 'circlize'),
                 repos = 'https://cloud.r-project.org')
install.packages('BiocManager')
BiocManager::install('ComplexHeatmap', ask = FALSE, update = FALSE)

source('run.R')
That’s it. No notebook archaeology, no “wait, which chunk made the heatmap again.” Every plot function also works standalone if you just want one panel for a talk instead of the whole gallery.
Code’s right here, help yourself: r-rnaseq-plot-gallery