scRNA-seq: Tracing the Barcode Disagreement Between Cell Ranger and Simpleaf
Why this question
Nextflow orchestrates and records each analysis, and nf-core/scrnaseq offers several standardized routes for processing single-cell RNA-seq data. I wanted to know: given the same sequencing data, why do different routes retain slightly different sets of cells? Are the extra barcodes real cells, ambient RNA, or low-quality droplets? And do they change any biological conclusion?
Methods
The data are the public 10x PBMC 1k v3 dataset, processed with nf-core/scrnaseq 4.2.0. Both routes used the same FASTQ files and the GRCh38-2024-A reference: Cell Ranger used the prebuilt index, and Simpleaf built its own index from the FASTA/GTF in the same package.
Versions: Cell Ranger 10.0.0, Simpleaf 0.19.5, QCatch 0.2.12. The comparison is Cell Ranger versus Simpleaf + QCatch: Simpleaf produces the counts, and QCatch performs the subsequent cell calling.
Upstream processing ran on an AWS r6i.4xlarge instance (16 vCPU, 128 GiB). A CloudFormation template installed the software, ran the analysis, uploaded the results, and then terminated the instance automatically. The successful run took 84 minutes end to end. The bill came to about $2.05 including three failed attempts; the successful run alone cost about $1.41. All downstream comparisons for this sample ran on a personal Mac with 8 GB of RAM.
1. Which barcodes differ?
I first compared three barcode sets: retained by both, by Cell Ranger only, and by Simpleaf + QCatch only.
# Read both filtered results and harmonize the barcode suffix
shared = cr_cells & sa_cells
cr_only = cr_cells - sa_cells
sa_only = sa_cells - cr_cells

print(len(shared), len(cr_only), len(sa_only))
# 1221 0 7
print(len(shared) / len(cr_cells | sa_cells))
# 0.9943: intersection / union
All 7 barcodes sit in the transition zone between cells and background.
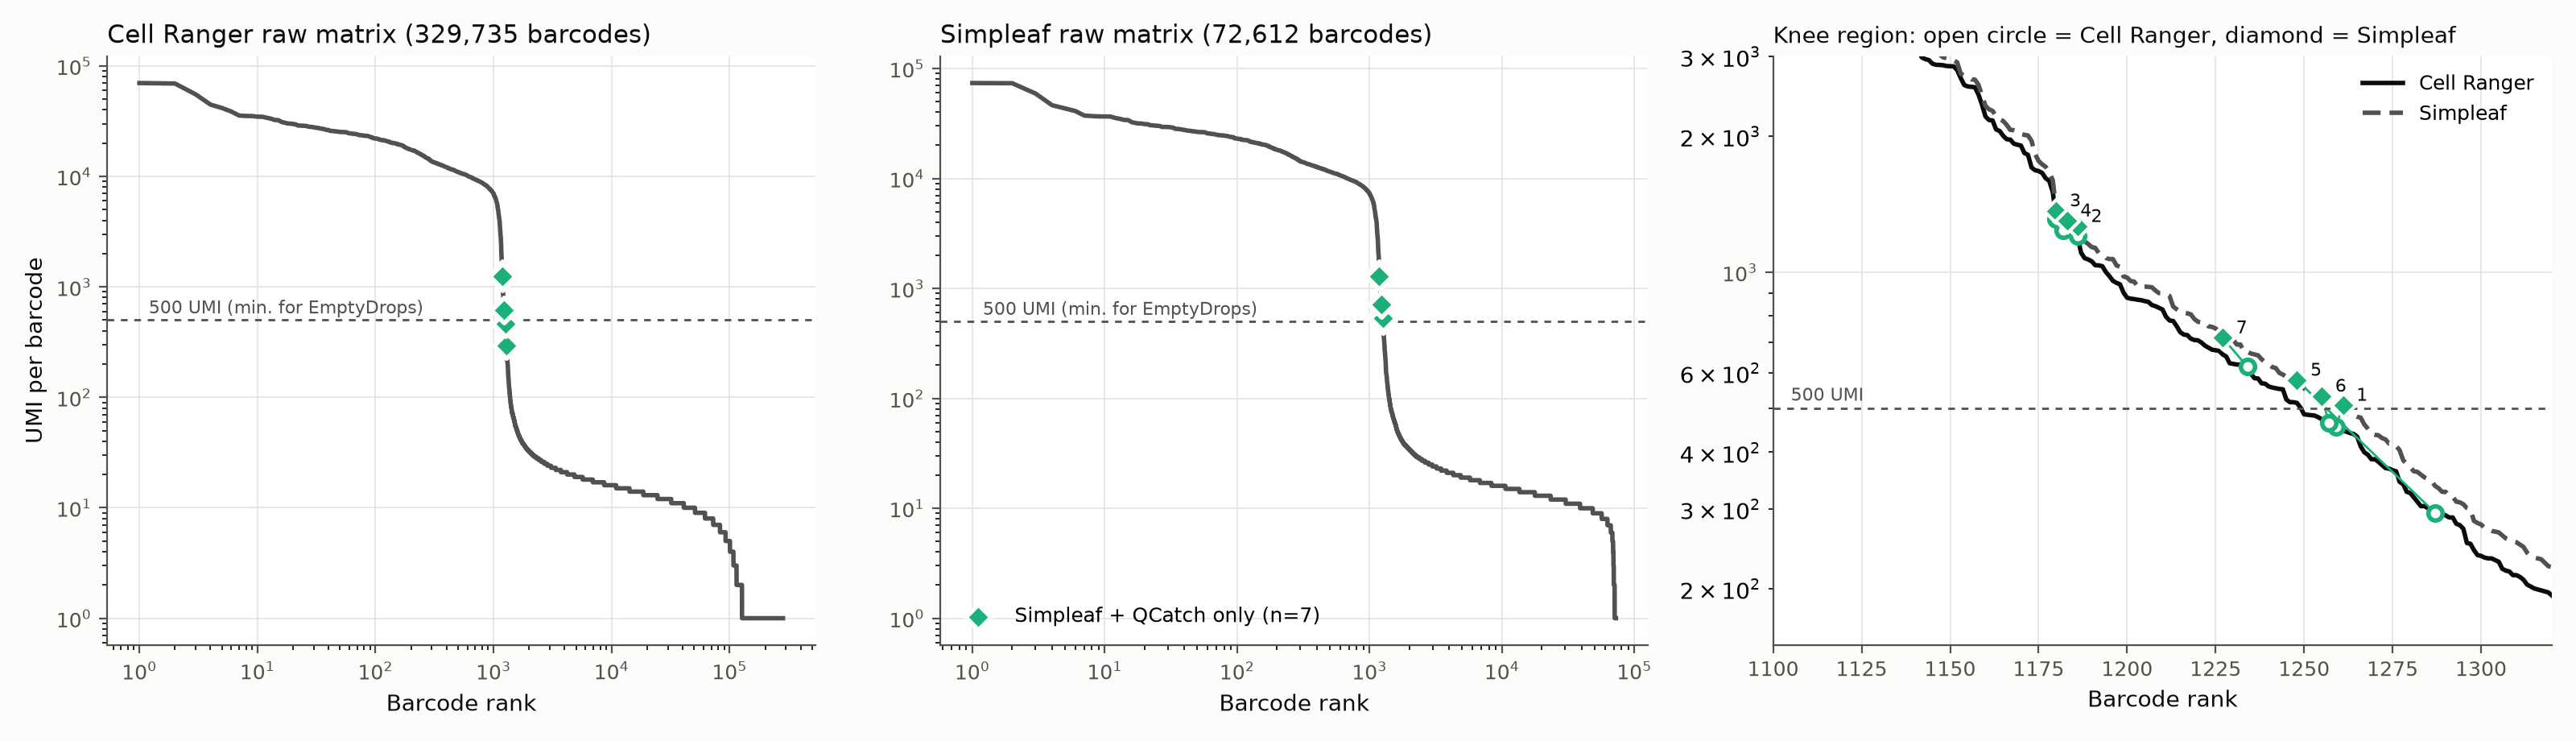
The x-axis is barcode rank by UMI count; the y-axis is UMI count. In the right panel, open circles are Cell Ranger and diamonds are Simpleaf; a line joins the two values for the same barcode. The 500-UMI line is the testing threshold of this implementation, not a fixed value for every EmptyDrops analysis.
Measured as intersection over union, the two cell sets agree at 99.4%. Among shared cells, the Spearman correlation of total UMIs per cell is 0.9997, and Simpleaf counts are about 5% higher on average. Overall agreement is very high, but small differences can decide whether a borderline barcode is kept.
Note also that the two “raw matrices” in the figure contain 329,735 and 72,612 barcodes. They were retained under different upstream rules, so they cannot be treated as the same universe of droplets.
2. Do the 7 extra barcodes look like real cells?
| # | Initial call | UMI: CR → SA | Genes detected | Mitochondrial fraction |
|---|---|---|---|---|
| 1 | Platelet-like: PPBP, PF4 | 455 → 508 | 178 | 6% |
| 6 | Platelet-like: PPBP | 464 → 532 | 172 | 18% |
| 2 | cDC-like: FCER1A, CST3 | 1,200 → 1,262 | 753 | 5% |
| 3 | Monocyte/DC-like: LYZ, CST3 | 1,309 → 1,366 | 815 | 7% |
| 4 | FCGR3A monocyte-like | 1,239 → 1,298 | 802 | 3% |
| 5 | Low quality, no clear marker | 294 → 577 | 121 | 52% |
| 7 | Low quality, no clear marker | 618 → 716 | 67 | 90% |
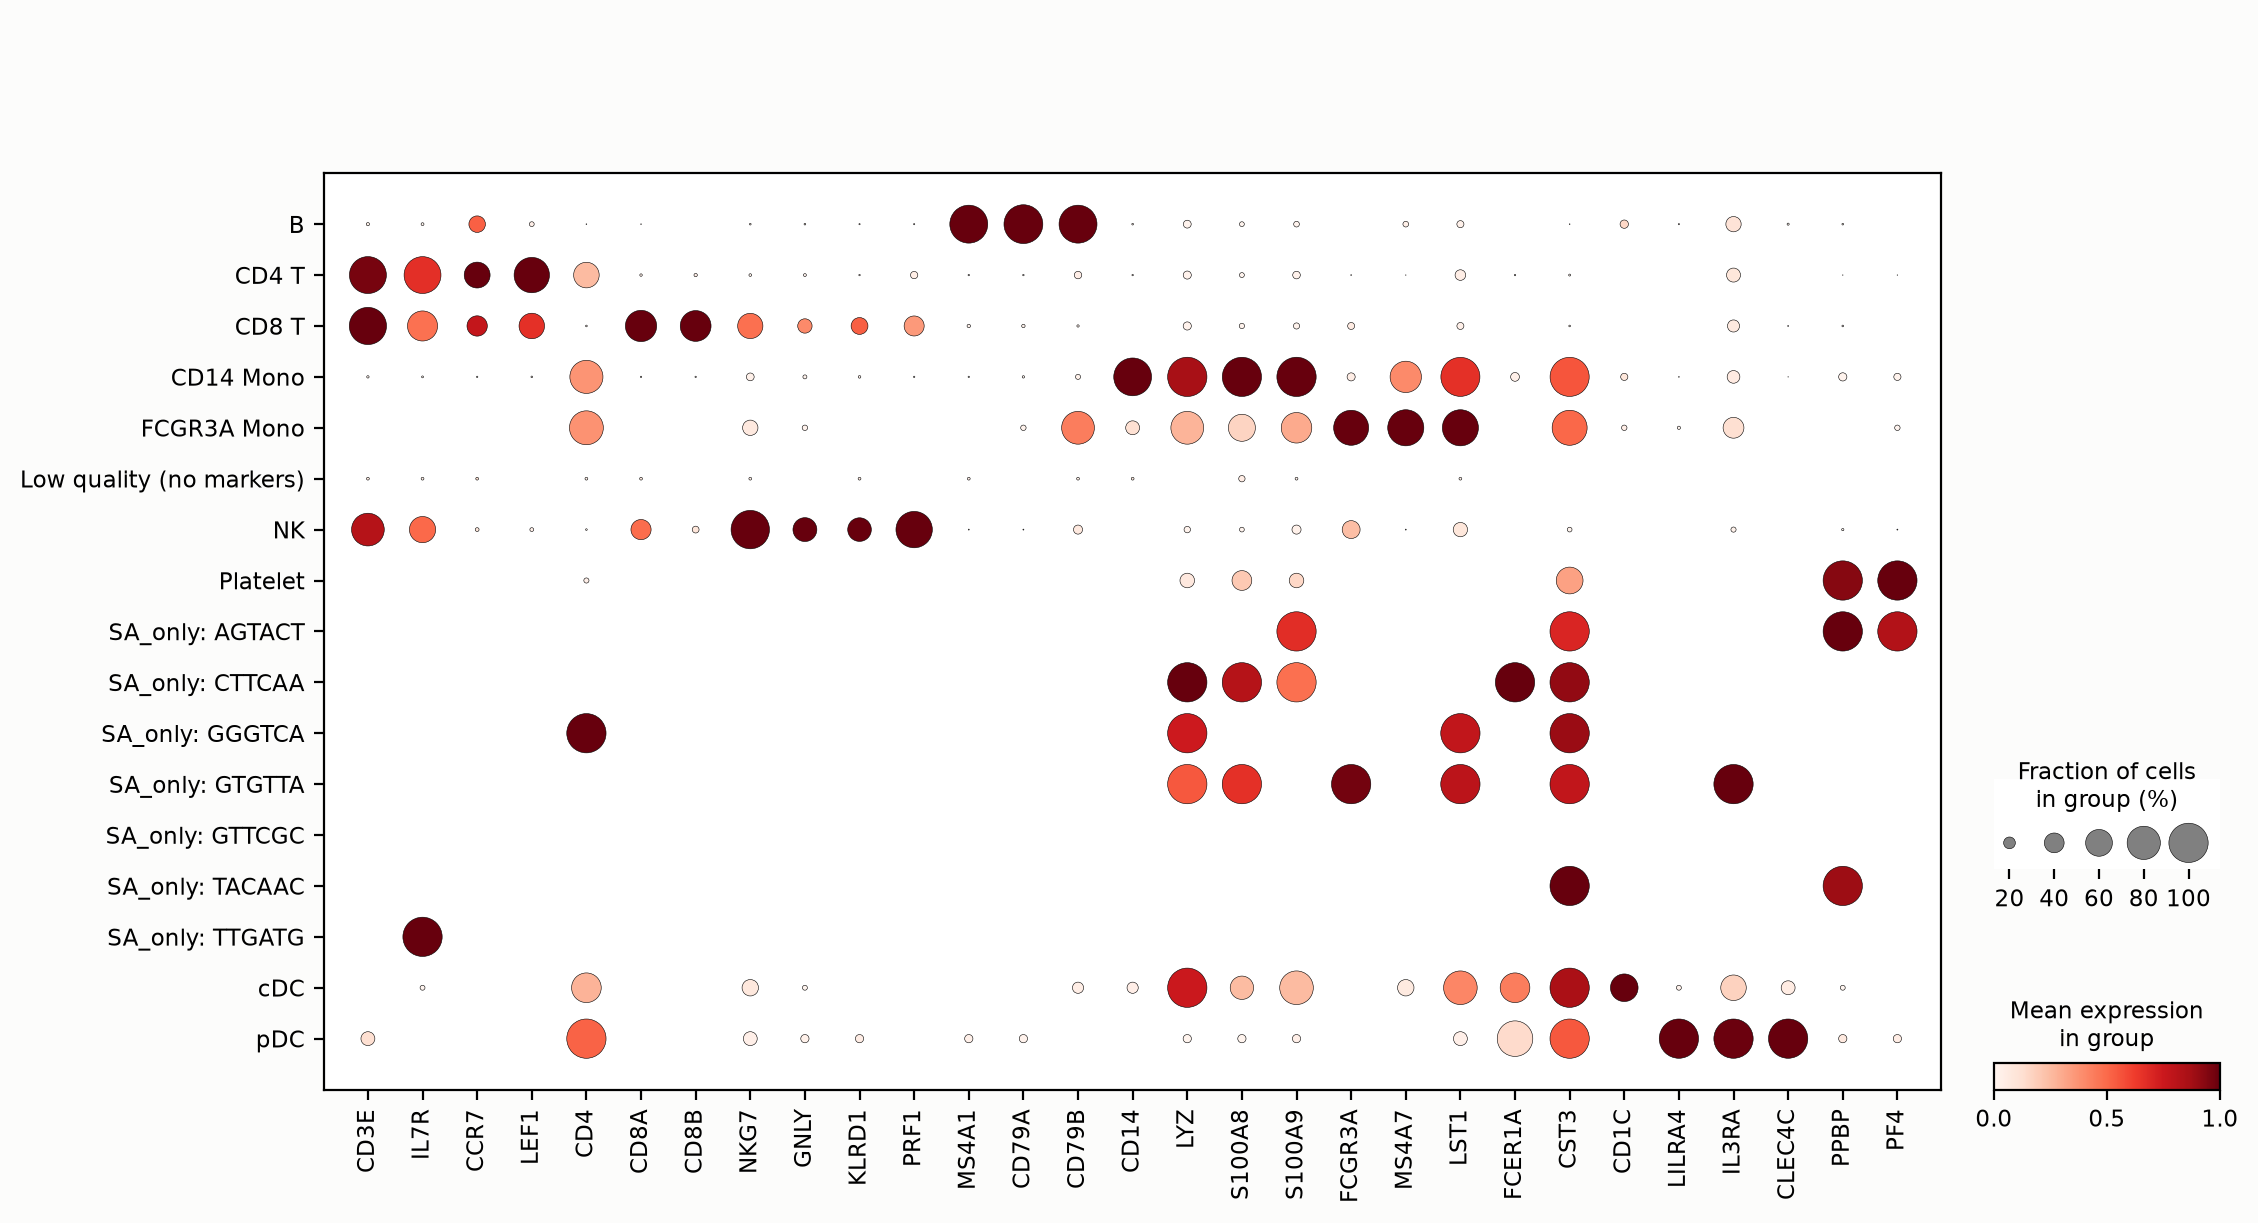
Dot size is the fraction of cells with detected expression; color is relative expression. Each SA_only row is a single barcode, labeled with its initial call.
Barcodes 1 and 6 carry platelet markers. Low UMI does not mean an empty droplet: platelets contain very little RNA to begin with. Barcodes 5 and 7 have very high mitochondrial fractions; they should be flagged as low-quality candidates rather than declared “dying”.
Low sequencing depth depresses expression correlations, so I built depth-matched controls: cells of the same type downsampled to the same depth, and empty droplets simulated from the ambient RNA profile.

The x-axis is correlation with ambient RNA; the y-axis is correlation with the candidate cell type. Blue: downsampled cells; gray: simulated empty droplets; green: disputed barcodes.
Barcodes 1 and 6 sit closer to the platelet controls. Barcode 7 is far from the simulated empty droplets and barcode 5 falls between the two groups; neither result means the barcode passes quality control. For barcodes 2, 3 and 4 the two control groups barely separate: ambient RNA resembles the monocyte/DC expression profile, so correlation alone cannot decide whether they are cells.
3. Different cell-calling algorithms, or different input counts?
I re-called cells in both matrices with the same QCatch code and parameters, using the OrdMag + EmptyDrops framework.
# Excerpt of QCatch internals; m is a CountMatrix, cc is the cell-calling module.
# Imports, versions and matrix conversion are in analysis/; this is not a standalone script.
initial = cc.initial_filtering_OrdMag(m, "10X_3p_v3", None)
res = cc.find_nonambient_barcodes(m, initial, "10X_3p_v3", None)
called = {b.decode() for b in initial} | set(res.eval_bcs[res.is_nonambient])
The Cell Ranger matrix still yields 1,221 cells and the Simpleaf matrix still yields 1,228, each identical barcode for barcode to the original results. Changing the random seed and the number of simulations did not remove the disagreement either.
The same implementation still disagrees, so the next place to look is the input matrices. The input differences, however, include both the counts and the range of background barcodes, so the disagreement cannot be attributed to a single factor.
Three barcodes crossed the 500-UMI threshold
Barcodes 1, 5 and 6 have fewer than 500 UMIs in the Cell Ranger matrix, so they never enter this step’s test against the ambient background; in the Simpleaf matrix they exceed the threshold. DHFR accounts for a substantial share of the extra counts.
| # | Total UMI gain | DHFR gain | SA UMIs after removing DHFR and one chr8 lncRNA |
|---|---|---|---|
| 1 | 53 | 19 | 485 |
| 6 | 68 | 29 | 495 |
| 5 | 283 | 236 | 341 |
After removing these two genes and re-calling cells, none of the three barcodes is retained. The counts of a few genes are enough to decide whether a barcode is tested at all.
The DHFR difference also appears in the shared cells: Simpleaf counts 45,624 UMIs (45,532 of them unspliced), whereas Cell Ranger counts 739. I then examined the DHFR region in the Cell Ranger BAM:
from collections import Counter
import pysam

# BAM_URL and BAI_URL are temporary access links to an existing BAM and its index.
with pysam.AlignmentFile(BAM_URL, index_filename=BAI_URL) as bam:
    mapq = Counter(r.mapping_quality
                   for r in bam.fetch("chr5", 80626226, 80655002))
print(mapq)
# Counter({1: 4718, 3: 2747, 255: 1519, 0: 4})
About 83% of the alignment records have MAPQ below 255. These records are concentrated in a single ~200 bp intronic window, with NH tags of 2–4: each read aligns to 2–4 locations in the genome.
A repeated sequence is the lead for the anomalous DHFR counts. The two routes use different reference targets and different alignment/assignment rules, which may send these reads to different places. I did not verify Simpleaf’s read-by-read assignment, so the mechanism remains an inference, and the chr8 lncRNA cannot be assumed to share the same cause by analogy.
Note: Cell Ranger adjusts MAPQ according to gene assignment, so its behavior cannot be reduced to “counting only uniquely mapped genomic alignments”. MAPQ = 255 does not necessarily mean the original STAR alignment had a single location. See the 10x BAM tag documentation.
The other four sit near the statistical threshold
Barcodes 2, 3 and 4 are all tested, but their adjusted p-values go from about 0.004 with Cell Ranger to about 0.0001 with Simpleaf, crossing this run’s 0.001 threshold. Barcode 7 is also near the threshold. I found no single clear source for these; for now the explanation stops at the statistical threshold rather than at the level of individual reads.
Finally: do these 7 barcodes matter?
For cell-type proportions: almost not at all. I held the counts, clustering and annotation fixed and changed only the cell set. The 7 extra barcodes fall into 4 groups: 2 platelets, 2 cDCs, 1 FCGR3A monocyte and 2 low-quality barcodes. Every other cell type keeps exactly the same number of cells; only the denominator grows from 1,221 to 1,228, diluting their proportions by at most 0.16 percentage points. After a common QC filter (≥ 200 genes, ≤ 20% mitochondrial), only 3 cells differ: 2 cDCs and 1 FCGR3A monocyte.
How small is that change? As controls, I changed only the clustering random seed, or only the count matrix, within the same workflow:
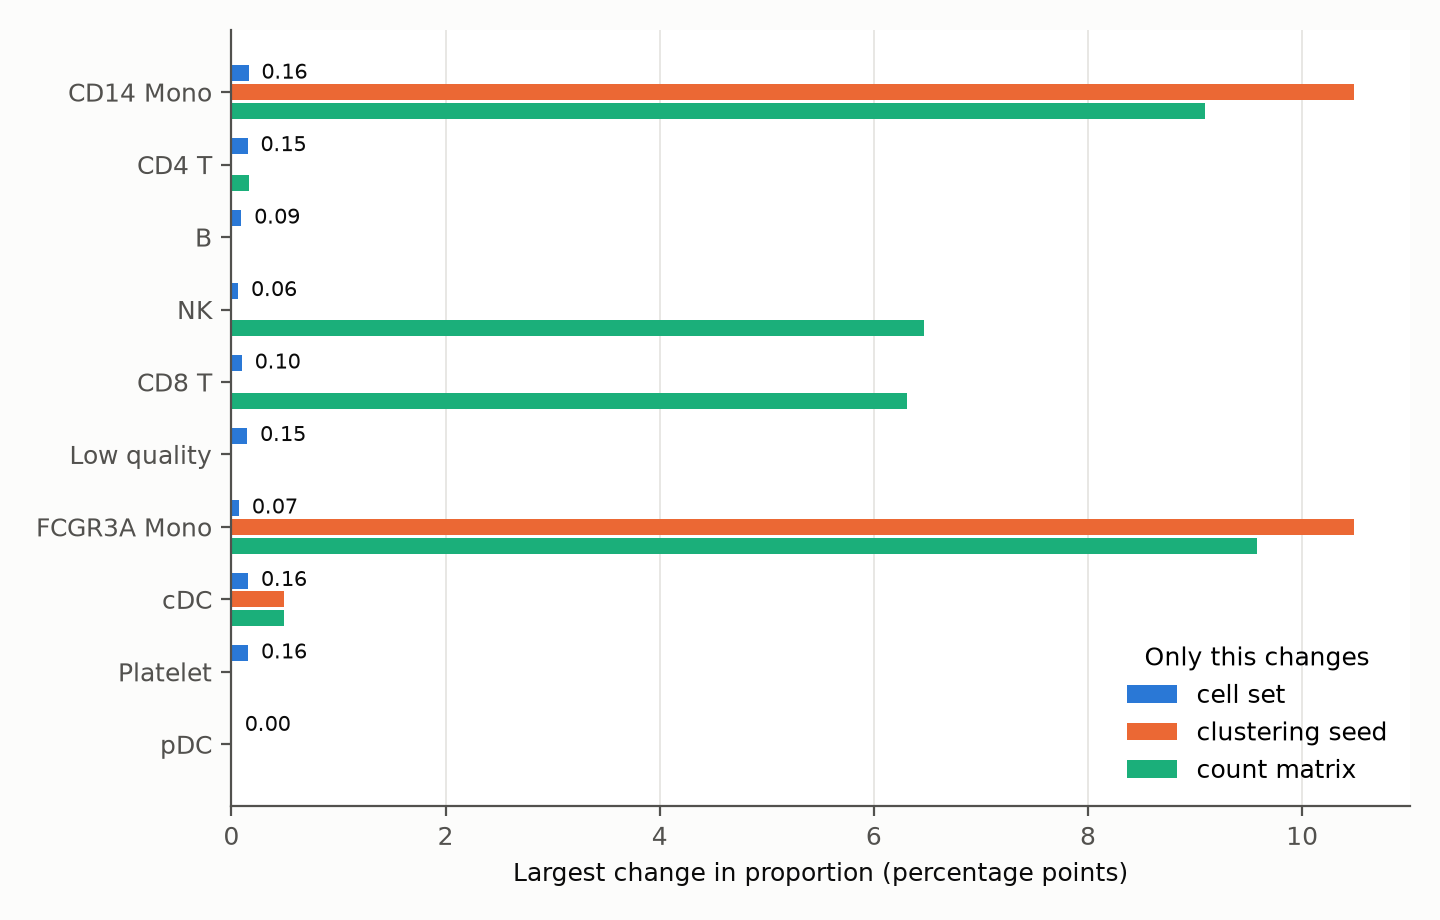
Blue: only the cell set changes; orange: only the clustering random seed (0–4); green: only the count matrix (Cell Ranger or Simpleaf).
The cell set shifts proportions by at most 0.16 percentage points, whereas the random seed or the count matrix shifts the monocyte and NK/CD8 T proportions by 6–10 percentage points. The latter two reflect my simple clustering/annotation approach and should not be generalized into a difference between the tools. The sensitivity of the annotation to analysis settings deserves more scrutiny than these 7 barcodes.
For markers of small cell populations: some effect, but limited. The cDC population has only 16 cells, so 2 more is a 12.5% increase.
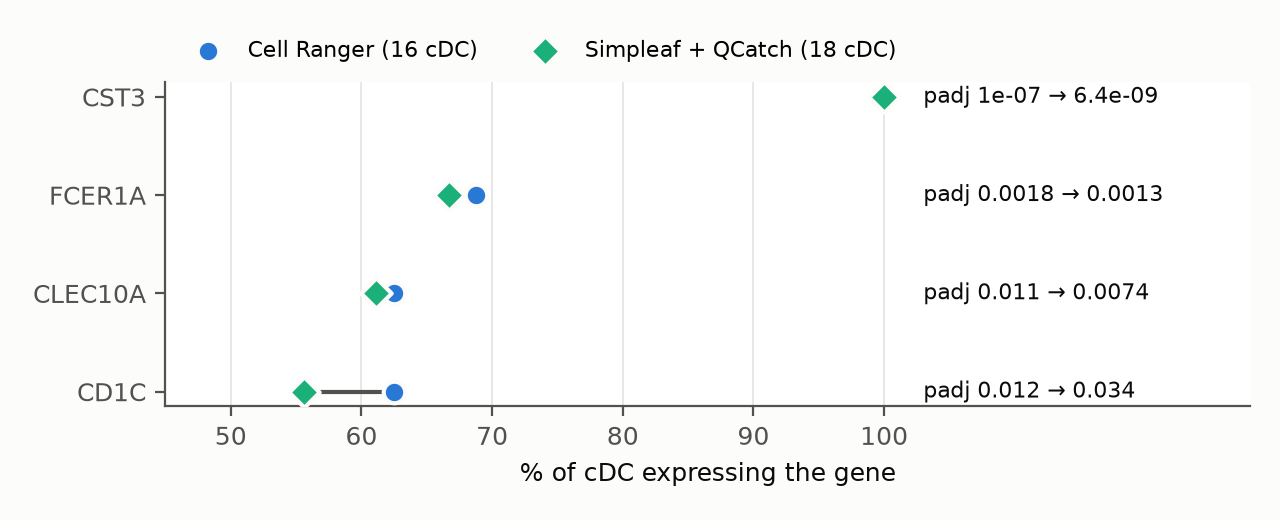
The conclusions for CST3, FCER1A and CLEC10A are unchanged. CD1C weakens: its expression fraction drops from 63% to 56% and its adjusted p-value rises from 0.012 to 0.034, because the 2 added cells do not express CD1C. In addition, after QC both sides contain the same 15 platelets, yet PPBP’s marker rank moves from 13th to 1st because the top genes have nearly tied scores. When reading markers, look at expression fraction, effect size and statistical evidence, not rank alone.
Conclusion
From the same FASTQ files, Cell Ranger retains 1,221 cells and Simpleaf + QCatch retains 1,228, with the former entirely contained in the latter. I traced the 7 extra barcodes: 3 crossed the UMI threshold because of extra counts, with a repeated sequence in a DHFR intron as an important lead; the other 4 sit near the statistical threshold. Changing only the cell set shifts cell-type proportions by at most 0.16 percentage points. These 7 barcodes have little effect on overall cell-type proportions, but a few genes combined with fixed thresholds are enough to decide whether a barcode is kept. Both comparisons used a single PBMC sample; whether the two workflows agree this closely on other data remains to be tested.
Reproducibility
- AWS template: scrnaseq-comparison.yaml.